


Material inventory
See how much of each material your project holds, what it is worth, and how the stock moved.
- Where to find it
- Stores > Material Inventory
- Who can use it
- People who have the View permission on Material Supply.
Material inventory is the stock of each material at one project. For example, Acme Heights received 500 bags of cement, sent 50 bags to another project and gave 100 bags to contractors. The stock is 350 bags. This screen shows that figure for every material, with its average rate and its value.
Before you start
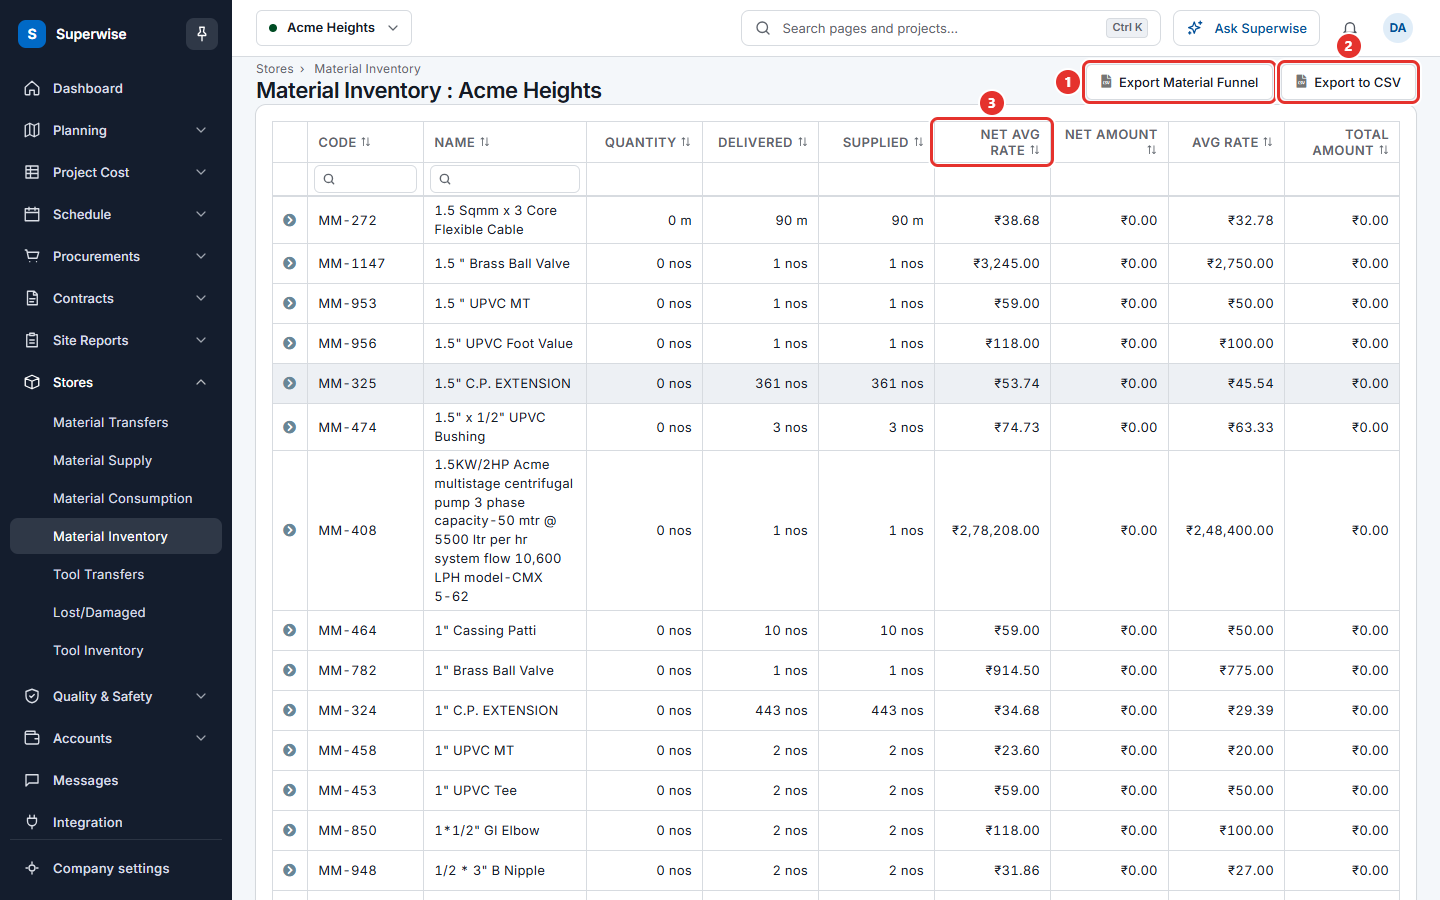
- Select the project in the project selector at the top of the screen. The title of the page shows the project, for example Material Inventory : Acme Heights.
How the stock is worked out
The Quantity of a material is:
- the quantity delivered to the project, plus
- the quantity received from other projects by material transfer, minus
- the quantity sent to other projects by transfer, minus
- the quantity supplied to contractors.
Use of material by a contractor (material consumption) does not change the stock. The material already left the stock when it was supplied.
How to read the list
- Open Stores > Material Inventory.
- Use the Search box, or the filters under CODE and NAME.
- Read the columns in the table below.
- At the bottom of the list, read the totals of NET AMOUNT and TOTAL AMOUNT.
A red warning sign before a quantity means the stock is below the minimum stock level that was set for the material. Hold the pointer on the sign to see the minimum level.
How to see the movement of one material
Click the arrow at the start of a row. The Movement tab shows each delivery, supply and transfer of that material for the project.
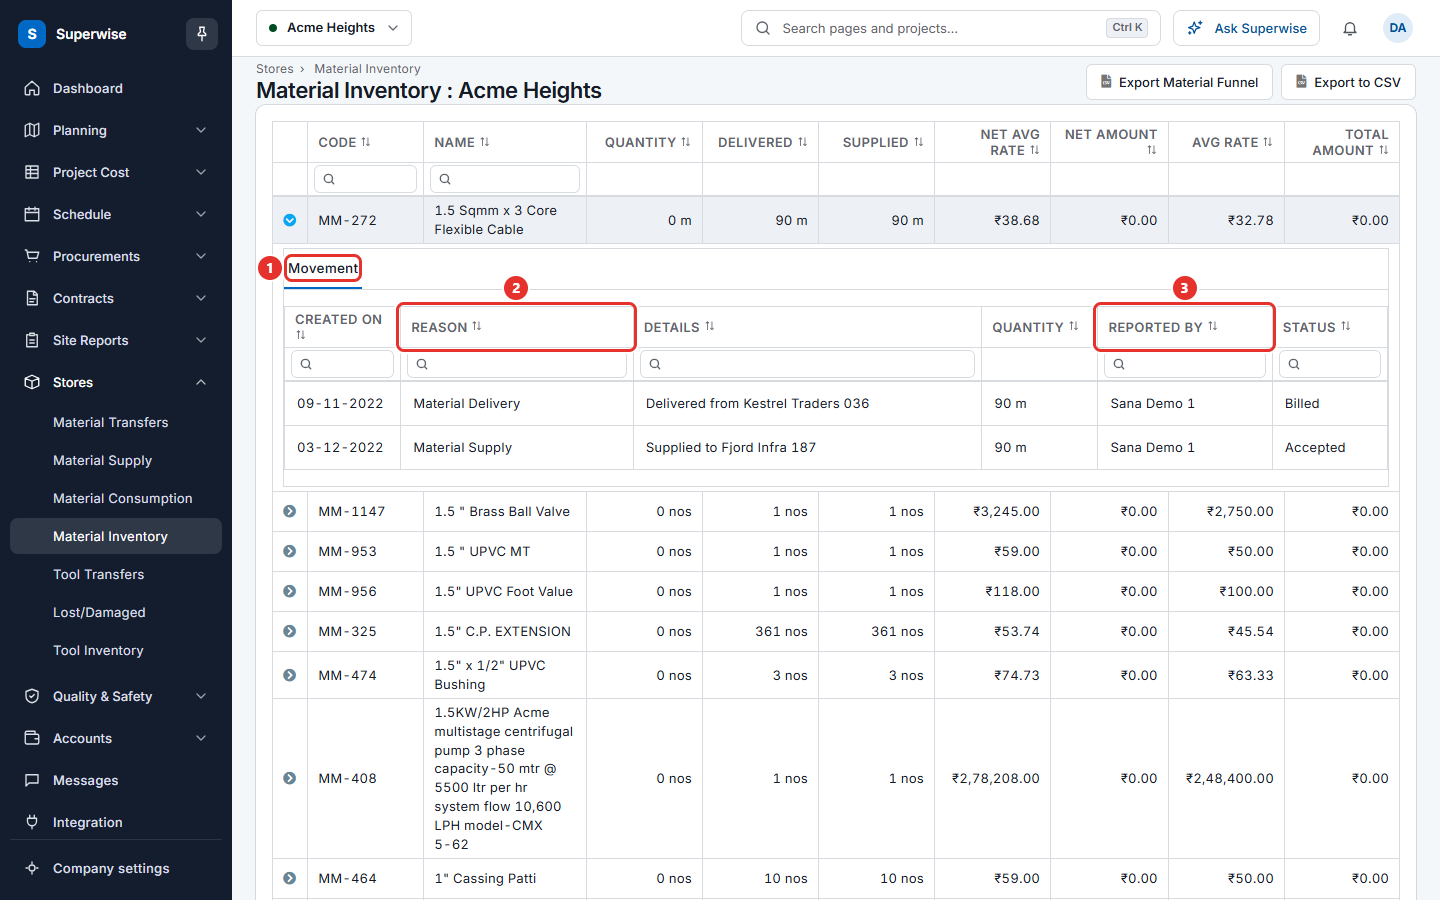
You can filter the movement by Created On, Reason, Details, Reported By and Status.
How to save the data as a file
- Click Export to CSV to save the list.
- Click Export Material Funnel to save a workbook that follows each material from the plan to the stock. It shows the planned quantity, the indented quantity, the purchased quantity, the delivered quantity, the quantity supplied, the quantity moved by transfer, and the stock.
What the columns mean
| Name | What it means |
|---|---|
| CODE | The code of the material. |
| NAME | The name of the material. |
| QUANTITY | The stock now, with the unit. |
| DELIVERED | The total delivered to the project. |
| SUPPLIED | The total supplied to contractors. |
| NET AVG RATE | The average rate of the deliveries, with tax. |
| NET AMOUNT | The value of the stock at the net average rate. |
| AVG RATE | The average rate of the deliveries, without tax. |
| TOTAL AMOUNT | The value of the stock at the average rate. |
Rules to know
- The list shows one project at a time.
- The rates come from the deliveries of the project. A material that arrived only by transfer has no delivered quantity.
- A material appears in the list as soon as it has a delivery, a transfer or a supply.
If something goes wrong
| What you see | What to do |
|---|---|
| No Records | The project has no stock. Check the project selector. |
| A quantity looks too low | Open the Movement tab. Look for supplies and transfers that left the project. |
| A quantity looks too high | Check that the supplies and transfers were saved. A transfer lowers the stock of the sending project when it is saved. |