


Gantt chart
See the schedule as bars on a time line, choose which part of the project to show, and export the chart to Excel or PDF.
- Where to find it
- Schedule > Gantt
- Who can use it
- People who have the View Tasks permission.
The Gantt chart draws each task as a bar. The bar starts on the start date and ends on the finish date. The part of the bar that is filled shows the progress. Lines between bars show which task waits for which. Use the chart when you want to show the plan to others or to print it.
The chart is read only. You cannot move a bar to change a date. To change the plan, use the Playground.
Before you start
- The project needs a schedule. See Create a schedule.
- Choose the project at the top of the page.
How to show the chart
- Open Schedule > Gantt.
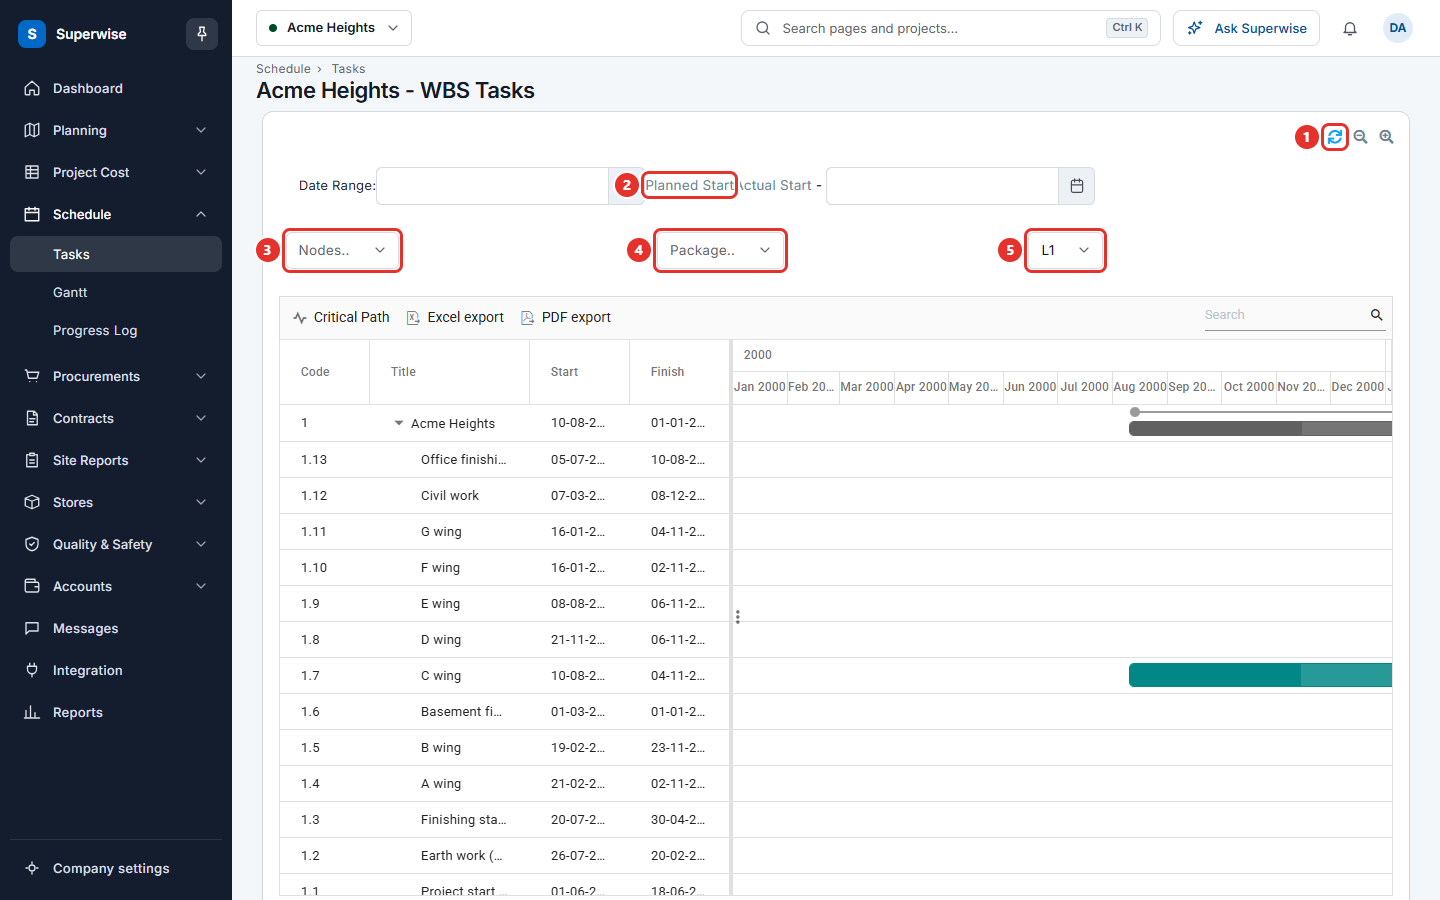
- Choose the WBS level (mark 5). Level 1 shows the biggest groups. A higher level shows more detail. You must choose a level before the chart can load.
- To show only a time range, use Date Range. Choose a start date and an end date. The link Planned Start (mark 2) fills the start date with the first planned date of the project. The link Actual Start fills it with the first actual date.
- To show only some parts of the project, choose one or more nodes in the list Nodes.. (mark 3).
- To show the tasks of one package, choose it in the list Package.. (mark 4).
- Click the refresh icon (mark 1). The chart appears.
How to work with the chart
- Click the zoom in or zoom out icon at the top right to change the time scale. The scale runs from half years down to days. Hourly projects show hours at the lowest level.
- The toolbar of the chart switches on the critical path and searches for a task. It also exports the chart to Excel or PDF. The files are named
Project Timeline Export.xlsxandProject Timeline Export.pdf. - Weekends are shaded. The shading follows the working week of the project calendar.
What the columns mean
| Name | What it means |
|---|---|
| Code | The place of the row in the work breakdown structure, such as 1.8.44. |
| Title | The name of the area or task. |
| Start | The start date. |
| Finish | The finish date. |
| Progress | The percent of work done. |
| Package(s) | The packages of the task. When you choose a package, the column is named Resources. |
Rules to know
- The chart shows the dates of the live schedule.
- A milestone is drawn as a diamond.
- The chart is for looking only. Dates change only through a new revision of the schedule. See Revisions.
If something goes wrong
| What you see | What to do |
|---|---|
| The chart does not load after you click refresh | Choose a WBS level first. The chart needs it. |
| The chart is empty | Widen the Date Range or remove the node and package choices. |
| The page is empty | Reload the page. If it stays empty, tell your administrator. |